

dimarts, 5 de desembre de 2017
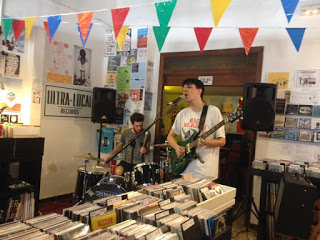
ANIVERSARI ULTRA-LOCAL RECORDS 5 ANYS

Aquest divendres celebrarem amb tots vosaltres el cinquè aniversari de la botiga aquesta. Moltíssimes gràcies a tots per aguantar-nos!
Gràcies infinites als artístes i djs que ens acompanyaran, la cosa anira, més o menys així:12:00h. Hip-Hip Ultra DJs
El tret de sortida de l’aniversari estarà en les mans i discos dels personatges del xou radiofònic Hip-Hip Ultra! Programa de ràdio que s’emet cada dissabte des de la botiga aquesta amb les millors persones del món. Es fotran d’osties per poder posar una cançó cadascú. Sang i faders per a tota la família.
https://www.youtube.com/channel/UCeMhfWqBqalqM5I-vPv8JOw
13:00h. Lo Guerssen DJ
Ens diuen que per primera cop a la vida Antoni Gorgues punxarà a lo dj. Responsable del segell Guerssen Records de Lleida, porten des de 1996 fent un exercici d’arqueologia musical, re-editant vinils impossibles de música experimental, psicodèlia i folklore. Un orgull tenir-lo a laUltra-Cabina!!! Tindrem les llibretes apunt per anotar tot el que ens vagi posant.
https://www.youtube.com/user/MrGuerssen/videos
14:00h. Núria Graham
La carrera musical de la Núria Graham ens acompanya des dels primers dies de la botiga i mai havia vingut a tocar. Amb el cinquè aniversari, i amb la recent sortida del seu nou disc “Does It Ring A Bell?” es donen les condicions perfectes per flotar amb les seves cançons. Ens deixarem portar per la seva música i el seu flow màgic, que ens suavitzarà i ens omplirà de gustera en cos i ànima.
https://www.youtube.com/watch?v=zjprFnkFuOM
18:00h. Bandicut
La tarda es preveu còsmica. Els primers que gravitaran per l’escenari (bueno escenari, la moqueta aquella que tenim) serà aquesta bonica banda de pop-electrónic en l’òrbita dels sons més ochenteros i admiradors de Franco Battiatto, entre d’altres referents molt estimats també per nosaltres. Serà un descobriment que farem tots junts.
https://bandicut.bandcamp.com/album/l-rica-binaria
19:00h. Adrià Ballús
L’Adrià Ballús ha publicat un dels millors discos de l’any “Onades”. Els seu folk fosc i eteri ens recorda totes les bandes per on ha passat i ha deixat la seva empremta. Art i creativitat en cada acord i punteig damunt un matalàs de cosmos i oceans. La seva inquietud ens portarà per un concert dividit entre el folk i la electrònica més cinemàtica. Imprescindible!
https://adriballus.bandcamp.com/
20:00h. Pacosan
Continuarem per la via làctia amb els grans Pacosan. Estimadíssims a casa nostra, vam col·laborar en l’edició de les primeres referències del grup, aquest any tornen amb “Sour Mood” un disc de ball cibernètic i com de ciència ficció. Un pas més per l’espai ingràvid, ple de fum i llums de colors. L’experimentació a la pista de ball i al servei de la cançó i el hit potencial.
http://pacosan.net/
21:00h. DJ Diego Armando
Adoctrinador des de la cabina, Xavier Riembau porta els darrers anys de la seva vida apassionant a la resta del món amb les seves sessions, recomanacions, xerrades, posades de discos... estem parlant de passió al servei dels plats. La seva ment inquieta no ens deixa esbrinar cap a on anirà la sessió que tancarà la festa d’aniversari, però el que si que sabem és que posi el que posi ens farà moure el cos, per dins i per fora.
https://www.youtube.com/watch?v=uLErIhIoMfc
*****
Bonus Track
El bonus track de l’aniversari arribarà el dia següent en forma de cinema i sessió. Serà cap a la tarda vespre.
MicroClima Sound El Documental
Director Vicenç Ferreres
Spain / 64 min. / 2017 / Catalan, Spanish
Farem un “pase” a la botiga del documental que van registrar els amics de Plans Films durant el festival MicroClima Sound 2016 que va tenir lloc a la botiga aquesta, i que es va presentar en el passat Festival In-Edit. Ara ja el podem veure sense plorar
https://www.filmin.es/pelicula/microclima-sound
DJ Miqui Puig
Els primers dies d’obrir la botiga ens van fer una quantes entrevistes, gent que flipava que obríssim una botiga de discos llavors. De les primeres persones que ens va trucar va ser l’Albert Vinyoli des de Rac1. Joder erem molt fans d’avisans quan arribi el 2000. Doncs ens va trucar ell perquè en Miqui Puig li va dir que obria una botiga de discos. Joder també som molt fans d’en Miqui Puig. Ens encabta quan ve a comprar discos i ens acaba recomanant a nosaltres mateixos discos que tenim a les cubetes de 1€. Bon gust i refinada selecció de discos des de la Ultra-Cabina, serà un honor teneir-lo posant discos per aquí.
http://www.miquipuig.com/
Us estimem bastant
Carme+Raül
dissabte, 28 d’octubre de 2017
dijous, 26 d’octubre de 2017
MicroClima Sound - In-Edit
Dilluns 30 d'octubre s'estrena MicroClima Sound el documental.
Ens fa entre vergonya i gràcia.
Moltes gràcies a la gent de Plans Films per l'interès :)
Comprar entrada cine
Ens fa entre vergonya i gràcia.
Moltes gràcies a la gent de Plans Films per l'interès :)
Comprar entrada cine


dijous, 31 d’agost de 2017
dimecres, 24 de maig de 2017
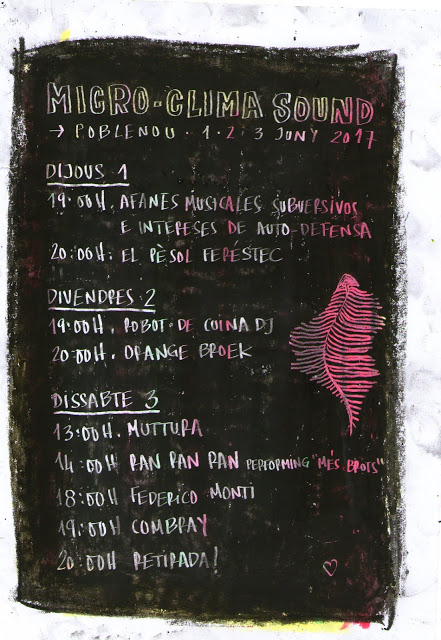
Micro-Clima Sound 2017 per Artístes!
Us presentem els artístes que formen part de la cinquena edició del Micro-Clima Sound. És un orgull molt fort!!!
Moltíssimes gràcies a tots
Federico Monti (RIBES)
Ambient/Abstract/Experimental
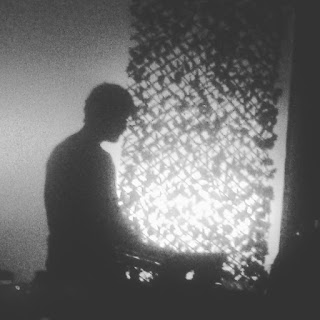
 És un immens honor que Federico Monti formi part del cartell del festival. Admirat i respectat per l’escena ambient, l’artista argentí porta des de 2003 al servei de la passió per a les atmosferes, els drones i la classe a partir de sons cíclics i processats amb elegància. Recentment acaba d’editar “Chemtrails” una coedició entre, el seu propi segell, Discos Noise i LIN, un altre petit segell de noise que forma part del underground més profund de la ciutat. A “Chemtrails” passa de les pessigolles a la membrana basilar, al so orgànic de codes vibrant. Serà un viatge audio-visual, de gran volada i ple de colors blaus.
El Pèsol Feréstec (LA PAU)
Poesia/Folk/Pop
 Ganes de cridar poemes, i ganes de pèsol! Un plaer salvatge i erudit tenir en la primera jornada del Micro-Clima Sound l’efervescència i el xiuxiueig d’aquesta estimada banda. El seu últim disc és colpidor. Una petita joia, un petit robí, on ells veuen magranes, nosaltres veiem maduixes salvatges. Tant se val. Les paraules sempre falten, o sobren. No sabem d’aquestes coses. La música va de Feelies ultra-locals. Les ganes son moltes i els poemes que trobem en el seu últim disc “Treure`n robins” editat per The Indian Runners són: tres musicats de la Maria Cabrera, dos dels quals els podreu llegir a La ciutat cansada (Óssa menor, 2017); un poema d’en Joan Vinyoli, 4 cançons seves i una versió del clàssic italià Ma il cielo è sempre più blu de Rino Gaetano.
Combray (TOMARES)
Ambient/Electrònica
 En el nostre objectiu de fer cada cop més petit el Micro-Clima, tindrem el plaer de comptar amb la família per a una de les actuacions més destacades del festi. I és que Combray és el so ambient de la botiga aquesta. Des del seu primer concert fins ara, el seu so ha anat mutant i despullant-se del dream pop original per vestir-se d’electrònica més experimental i textures que suren amb prudència. Actualment el Tesoro de Tomares està immers en noves composicions, sanefes i loops, que combina amb altres projectes musicals. Sempre és un gustazo compartir el trance amb els seus audios i visuals. A nosaltres ens flipa el que fa des del primer moment que ho vam escoltar.
Retirada! (MONTJUÏC)
Post Rock!
 L’avanzadilla del post-rock, la nova promesa del rock català, els Japandroids de Montjuïc... baixen de la cresta de l’ona per tocar a l’arena d’Ultra-Local. Després de llargues negociacions entre els nostres advocats i els del Primavera Sound, pel fet de formar part dels dos cartells, acceptem les dures condicions contractuals i de rider per gaudir d’un concert més èpic que trobar pàrquing davant de casa a Barcelona ciutat. Alites i braves per tothom!
Muttura (CIUTAT VELLA)
Art/Ambient
 En Guillem Gasulla és alguna cosa així com un home del Renaixement en una època en la que tothom diu que fa de tot però només alguns ho fan i no ho expliquen. Sorpresa emotiva vam tenir el dia de la descoberta d'aquest homenet que s'amaga darrera d'aquest ens que debutarà pel Micro-Clima Sound. Muttura és el nom que rep la humitat en alguns pobles de la regió de la Puglia italiana. En Guillem ens ha explicat que serà un micro concert d’ambient amb cançons que parlen sobre la creació artística. Coneixem els seus referents artístics i musicals però no ens sabem gaire més. Moltes ganes de la descoberta, de ben segur que després del concert li farem mil preguntes sobre aquest directe inèdit de debò
Ran Ran Ran performing “Més Brots” (VALLPARADÍS / EL CONGRÈS)
NeoFolk
 Si algun dia s’acaba la botiga aquesta, si alguna vegada desapareixem amb les nostres tonteries, sempre quedaran els discos. I un dels discos que ens ha marcat més, per moltes coses, és el ”Més Brots” de Ran Ran Ran. Per això serà molt bonic poder recuperar les cançons d’aquell primer germen que ara ja ha brotat amb discos excepcionals com Ran Ran Ran i com el seu últim treball l’Hereu. Editat tot per Bankrobber. Són els Shellac del Micro-Clima i els tindrem tots els anys. Sempre que ells vulguin, perquè ens encanta el que fan i perquè son unes persones enormes.
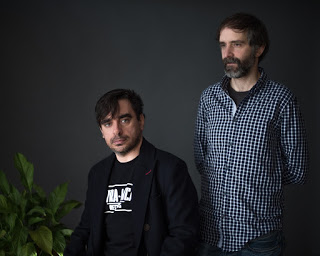
Orange Broek (FORT PIENC / POBLESEC)
Synthpop
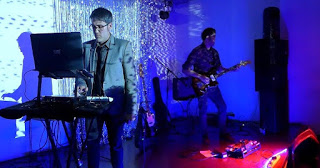 Orange Broek acaben de publicar “89”, el segon disc d’aquesta banda de synth-pop de la ciutat que estimem fort. Producció refinada i mirada als New Order amb la incorporació de l’Arnau a la guitarra. Ja fa molt temps que van passar per la botiga aquesta i ens van deixar encantats, ara tornen pel Micro-Clima diposats a reafirmar-se com una de les formacions més interessants del panorama synth-pop local. La seva recent expansió cap al pop, és un pas més enllà en el seu camí per consolidar-se i anar creixent. Cançons electròniques i univers Orange Broek!
Afanes Musicales Subversivos e Intereses de Auto-Defensa (BADALONA / WEST POBLENOU)
Poesia/Impro/Coses
 Després de ser seleccionats, amb un caset/loop anomenat “Minimespai” i creat conjuntament amb la Srta “Y” per a “Pequeño Objeto A” com a projecte convidat del FUNFANFEST a l’Arts Libris Barcelona 2017, arriba l’hora de fer algo en directe. “Algo”. Ho deixarem en aquesta paraula. “Algo”. No sabem que passarà. Segurament caos. Segurament crits. Sorolls. Loops... Números, lletres, mots, llampecs... Una mica de polipoesia i treball coral per donar el tret de sortida al festival amb algo que ens deixi to rotos. Serà locura.
Robot de Cuina DJ (POBLENOU)
Vocoders/Robots
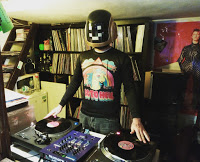 A l’edició d’enguany no apareixen djs. A nosaltres ens encanten les sessions, però mira, la cosa ha anat així. Només comptarem amb la sessió de Robot de Cuina DJ. Una selecció de música amb veus robótiques i vocoders a tope. Un experiment a partir d’un corset de robot que ens portarà per l’electro, el House, el post-rock i el pop conduït a través dels surcos i els faders d’un fan de Daft Punk. Si sous robots, no hi podeu faltar.
Moltíssimes gràcies a tots
Federico Monti (RIBES)
Ambient/Abstract/Experimental

El Pèsol Feréstec (LA PAU)
Poesia/Folk/Pop

Combray (TOMARES)
Ambient/Electrònica

Retirada! (MONTJUÏC)
Post Rock!

Muttura (CIUTAT VELLA)
Art/Ambient

Ran Ran Ran performing “Més Brots” (VALLPARADÍS / EL CONGRÈS)
NeoFolk

Orange Broek (FORT PIENC / POBLESEC)
Synthpop

Afanes Musicales Subversivos e Intereses de Auto-Defensa (BADALONA / WEST POBLENOU)
Poesia/Impro/Coses

Robot de Cuina DJ (POBLENOU)
Vocoders/Robots


Subscriure's a:
Missatges (Atom)